Hello!
Ask me any question about Lympik.
Please be as specific as possible so I can help you better.
Record and analyze data
Switch on the device by pressing the power button (~1s). Your Oculus device will flash blue to indicate that it is searching for a GPS signal. Once the signal has been found, the Oculus will automatically start recording and flash green. Searching for the GPS signal can take up to five minutes if there is a clear view of the sky.
We recommend that athletes switch their Oculus on as soon as they are on the track and switch it off again once they have finished training. You can stop the recording with a double click, after which the device will automatically search for an available Wi-Fi network to upload the data into the Lympik webapp. You can configure your device to upload data as soon as it is nearby a configured Wi-Fi as well. More information can be found in the additional information section.
Please note that the recording must be at least 30 seconds long.
Once Oculus has finished uploading your data, it is ready for immediate analysis in the web app. All data is displayed in tabular form in the results overview.
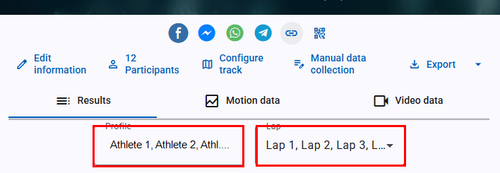
You can filter the displayed data by athlete and by lap:
Additional information can easily be entered in the app and saved at the event under 'Manual data entry':
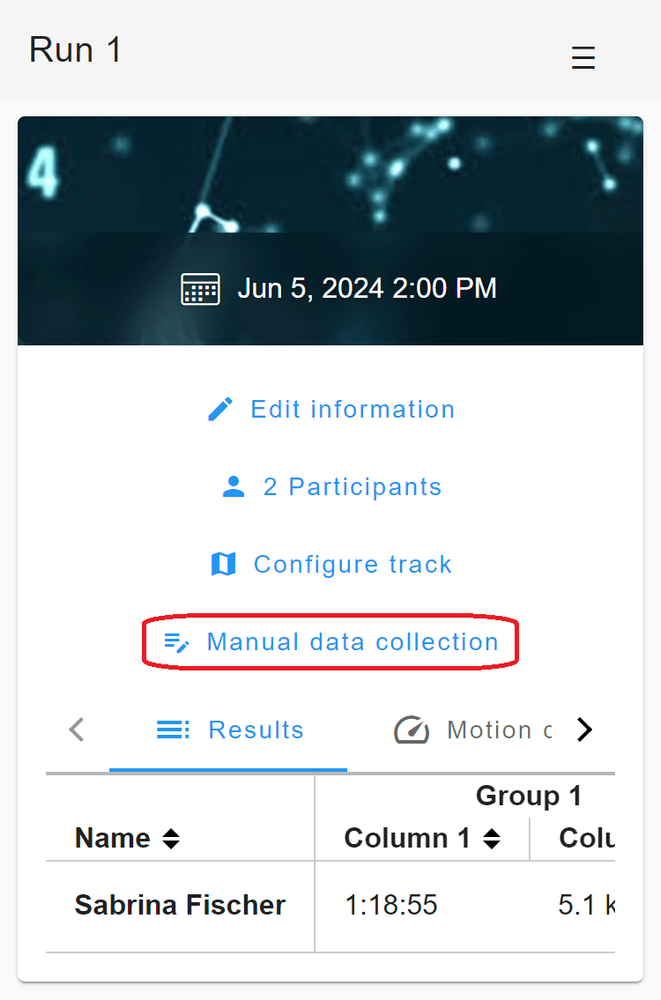
Here, you can add information such as blood lactate, heart rate, body weight, blood oxygen saturation and shot hits and more, and assign it to the relevant lap and athlete.
It is possible to evaluate one and the same data record in different activities with different configurations.
Motion data
You can view and analyse the runs in more detail on the map: navigate to Motion data and click on "Analyze":
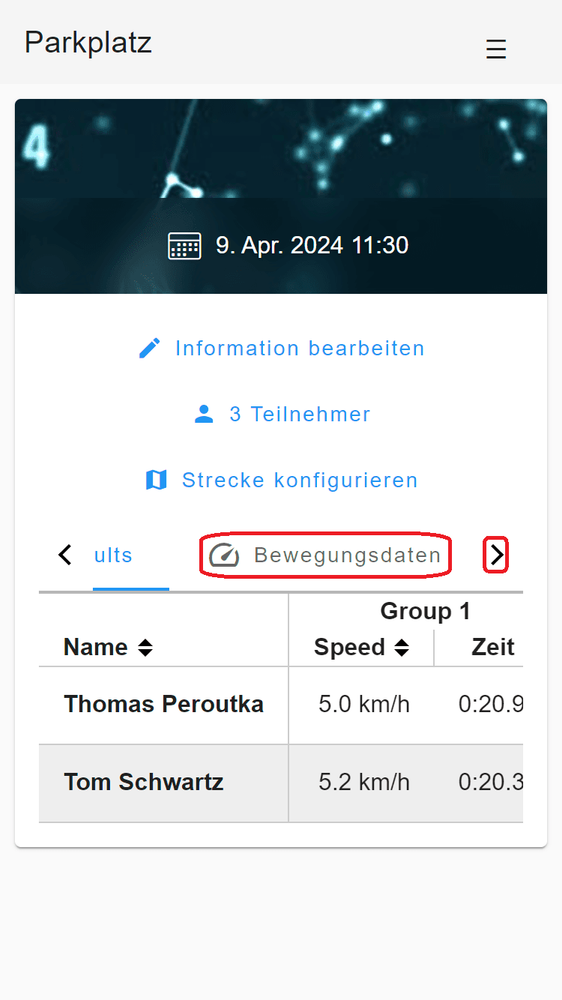
Here, you can see an overview of the data recorded by your tracker, which you can display by round or data set. You can also filter the data by athlete or lap. Click on "analyze".
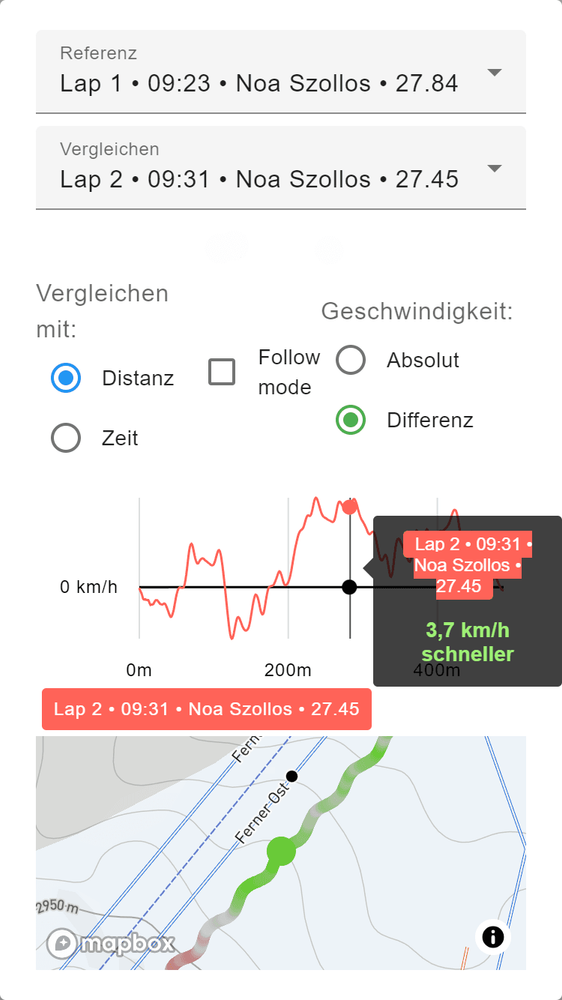
You can now select two runs to compare. Only runs that have been detected and analysed will appear in this list. You can now choose whether to compare different metrics as speed or acceleration with time or position. You can also display the absolute speed or acceleration or set it in reference to a reference run.
Moving the cursor over the graph will make the two athletes virtually ride the course again. You will see the difference in speed at that time. You can also view their respective positions at that time on the map. The colour gradient on the map shows where time was gained or lost at a glance. Setting the follow mode means the map moves with the analysis as soon as you move the cursor over the graph.