
Hello!
Ask me any question about Lympik.
Please be as specific as possible so I can help you better.
Track configuration
Click on 'Configure track' in your activity to be taken to the following view:
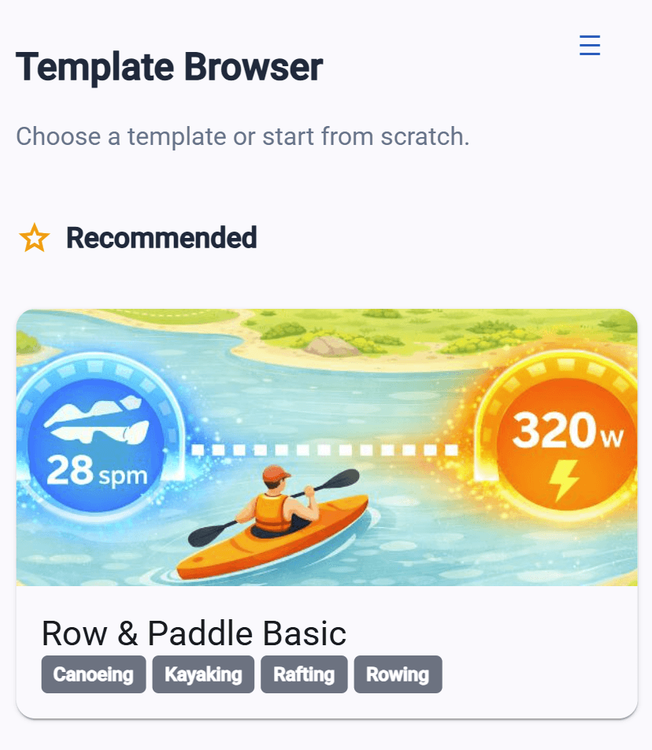
Here you can decide if you want to choose between a pre-created template or if you want to configure a custom-made track. The recommended template for rowing, kayaking and canoeing is "Row & Paddle Basic".
Row & Paddle Basic
After uploading your Oculus data, this template automatically transforms all collected information into clear, structured graphs and insightful result tables. In the track configuration, you can make the following settings:
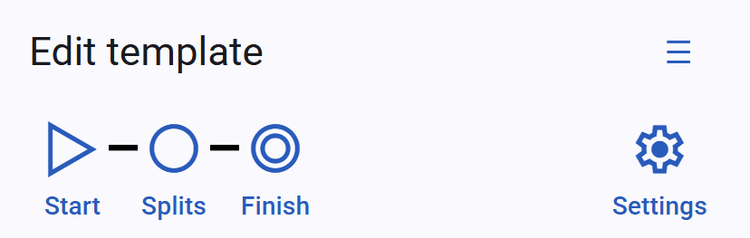
Start
By clicking on “Start,” you can choose whether automatic start detection is triggered by speed or by strokes.
Splits
By clicking on “Splits,” you can define splits based on either a specific distance or a set time. Additionally, the “Splits from end” checkbox allows you to calculate splits starting from the end instead of the beginning.
Finish
By clicking on “Finish,” you can choose how to end a lap by selecting detection based on speed or strokes. You could also choose a specific distance or time to end an interval.
Settings
By clicking on “Settings,” you can view the selected template, check when it was last modified, and adjust the speed unit used in the presentation. The default unit of the presentation in the result overview is km/h.
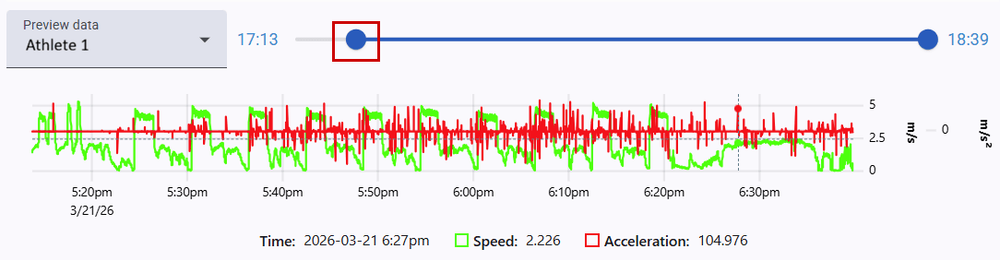
It is also possible to trim your dataset at the beginning or end if you recorded data before or after your session. When you are finished, click “Process” to be taken to the results overview.
Result overview
In the activity overview, you have two views to analyze your Oculus data. On the first page, “Results,” you can see graphs displaying speed over distance, distance per stroke, and stroke rate. In the results table, you will find the following metrics:
- distance (m) of splits within intervals
- split (min:s)
- time (s)
- pace (min/km)
- average speed (km/h)
- distance per stroke (DPS in m)
- stroke per minute (SPM)
- strokes
- load per stroke
- average power
- min speed (km/h)
- max speed (km/h)
- boat check (km/h)
Those metrics will also be shown in an interval summery. All results can be filtered by athlete or by Lap numbers.